
📚 Well Testing for Beginners — Part 2 of 5
What Is a Pressure Buildup Test?
A pressure buildup test (PBU) is the most common type of well test in the oil and gas industry. The idea is simple: produce the well at a steady rate, then shut it in and watch how the pressure rises back up. The speed and pattern of this pressure recovery tell engineers a great deal about the reservoir.
When a well flows, pressure near the wellbore drops. The reservoir pressure is higher further away. When you shut the well in, fluid from the reservoir keeps pushing inward, and the wellbore pressure gradually climbs back toward the original reservoir pressure. By measuring this climb precisely, engineers can calculate key reservoir properties.
How Is the Test Performed?
The test has two phases:
Phase 1 — The Flow Period
The well is produced at a constant rate — typically for a period called the “producing time” (tp). During this time, downhole pressure gauges record the flowing bottomhole pressure (FBHP). The flow period must be long enough to establish what engineers call a “stabilized” flow condition, where the pressure disturbance has traveled out into the reservoir.
Phase 2 — The Shut-in Period
The well is closed at the surface. The bottomhole pressure starts rising. This is called the buildup. Engineers record the pressure continuously — sometimes for hours, sometimes for days — using high-resolution electronic gauges. The pressure data from this period is what gets analyzed.
The Horner Plot: The Classic Analysis Method
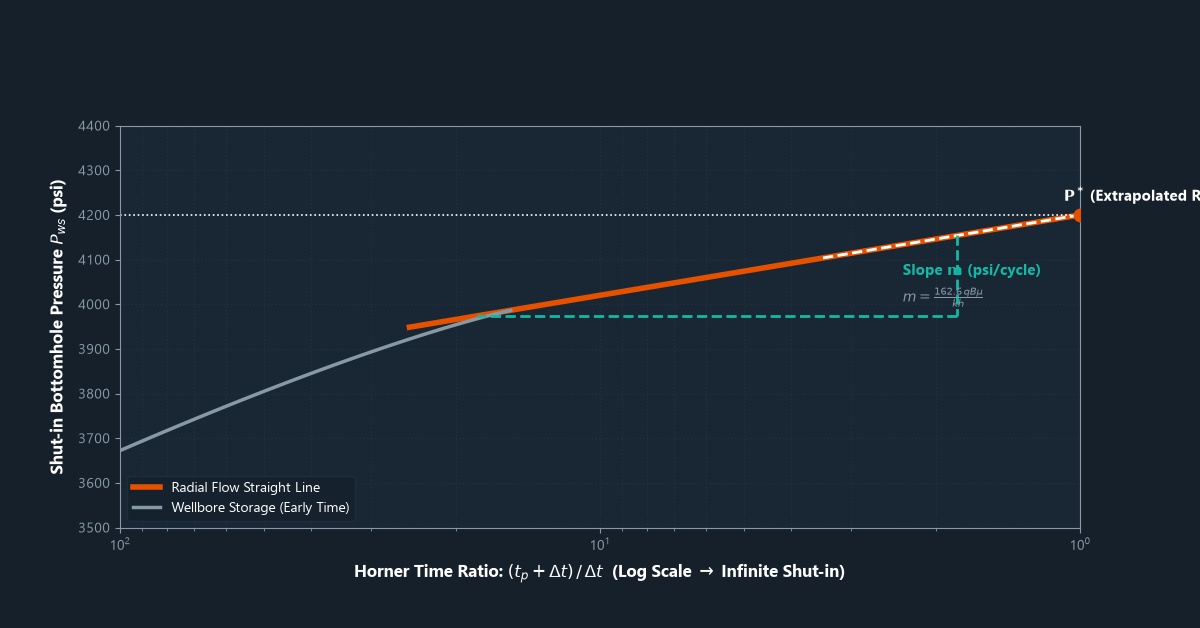
The traditional way to analyze a pressure buildup test is the Horner plot, developed by D.R. Horner in 1951. It is a graph of shut-in pressure versus a time ratio called the Horner time ratio (HTR):
HTR = (tp + Δt) / Δt
Where tp is the producing time before shut-in and Δt is the time elapsed since shut-in. The HTR is plotted on the x-axis (on a log scale, decreasing from left to right), and the shut-in pressure is on the y-axis.
When the data points form a straight line on this graph, it means the well is in what engineers call the middle time region (MTR) — the most important part of the test. The slope of this straight line is used to calculate permeability.
What Can You Calculate from a Buildup Test?
Permeability (k)
Permeability is calculated from the slope (m) of the straight line on the Horner plot:
k = 162.6 × q × μ × B / (m × h)
Where q is the flow rate (STB/day), μ is the oil viscosity (cp), B is the formation volume factor, m is the Horner plot slope (psi/cycle), and h is the net pay thickness (ft). This formula uses field units; SI units give a different constant.
Skin Factor (S)
The skin factor tells you if the well is damaged or stimulated. It is calculated using the pressure at 1 hour of shut-in (read from the straight-line portion of the Horner plot) compared to the flowing pressure just before shut-in.
A positive skin (S > 0) means the well is damaged — perhaps from mud filtrate invasion, fines migration, or scale. A negative skin (S < 0) means the well has been stimulated — for example by hydraulic fracturing or acidizing. A skin of zero is a “perfect” well with no damage or stimulation.
Average Reservoir Pressure (p*)
By extrapolating the straight line on the Horner plot to an HTR of 1 (which represents infinite shut-in time), engineers get the extrapolated pressure (p*). In a new reservoir not yet significantly depleted, p* equals the initial reservoir pressure. In a producing reservoir, engineers use a correction method (like the Matthews-Brons-Hazebroek method) to convert p* into the current average reservoir pressure.
Modern Analysis: Log-Log Derivative Plots
While the Horner plot is still used today, modern well test analysis relies heavily on the log-log pressure derivative plot. This graph plots both the pressure change (ΔP) and its derivative (ΔP’) on a log-log scale versus shut-in time.
The derivative is powerful because it amplifies features that the pressure curve alone might not show clearly. Different reservoir types (infinite-acting, faulted, fractured, layered) have characteristic “signatures” on the derivative plot that engineers can recognize. For example:
A flat derivative at middle time indicates a homogeneous reservoir — the classic infinite-acting radial flow. A rising derivative at late time can indicate a sealing fault boundary. A falling derivative at late time can indicate a large aquifer or constant-pressure boundary.
Frequently Asked Questions
How long should the shut-in period last?
A common rule of thumb is that the shut-in period should be at least as long as the producing period before shut-in. However, the actual required length depends on the permeability and what information is needed. In tight reservoirs (low permeability), buildup tests can require weeks to reach stabilization.
What is afterflow (wellbore storage)?
When a well is shut in at the surface, the wellbore fluid is still compressible and continues to flow into the wellbore for a while. This is called wellbore storage or afterflow. It masks the reservoir signal at early shut-in times. On the log-log plot, wellbore storage shows up as a “unit slope” line at early time. Engineers must identify this period and exclude it from straight-line analysis.
Can you do a buildup test on a gas well?
Yes, but gas is compressible, so the analysis uses a modified version called the pseudopressure approach (also called real gas pseudopressure or m(p)), developed by Al-Hussainy et al. in 1966. This accounts for how gas properties change with pressure and gives more accurate results than simply using pressure directly.
Summary
The pressure buildup test is a powerful diagnostic tool. By shutting in a well and carefully measuring how pressure recovers, engineers can calculate the formation permeability, the wellbore skin factor, and the average reservoir pressure — without any additional drilling. The Horner plot provides the traditional analysis framework, while the log-log derivative plot gives a more detailed picture of reservoir behavior.
In the next part, we will look at the drawdown test — the complementary approach where the well flows rather than shuts in — and explore the important concept of flow regimes.
➡️ Next in this series: Drawdown Test and Flow Regimes

Leave a Reply