
Part 6 of 10 in the series From Reservoir to Surface: Oil and Gas Production for Beginners. Previous part: Wellhead and Christmas Tree.
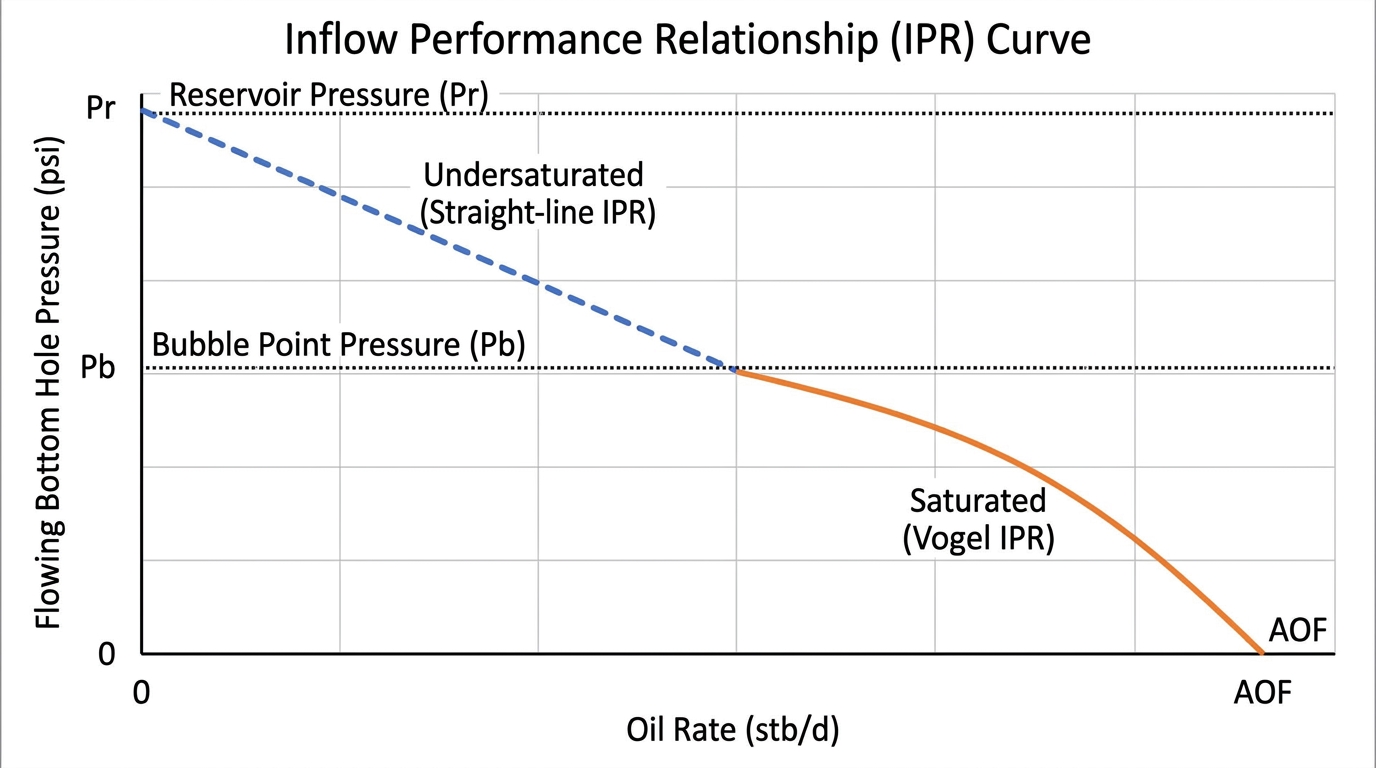
The inflow performance relationship (IPR) describes how much oil a well can produce from the reservoir at a given flowing bottom hole pressure. It is usually shown as a curve of flow rate versus flowing bottom hole pressure (Pwf). The IPR tells engineers how the reservoir will respond when they lower the pressure in the well, and it is the starting point for choosing tubing, chokes and artificial lift.

The Basic Idea: Drawdown
Fluid flows from the reservoir into the well because the pressure in the well is lower than the reservoir pressure. The difference is called drawdown:
Drawdown = Pr − Pwf
Where Pr is the average reservoir pressure and Pwf is the flowing bottom hole pressure. More drawdown means more flow, up to a limit. At Pwf = Pr there is no flow. The theoretical maximum rate at Pwf = 0 is called the absolute open flow (AOF), or qmax.
Productivity Index (PI)
The simplest way to describe inflow is the productivity index, J:
J = q / (Pr − Pwf)
In field units, J is in stock tank barrels per day per psi (stb/d/psi).
Example
A well has a reservoir pressure of 3,500 psi. During a test it produces 500 stb/d at a flowing bottom hole pressure of 3,000 psi.
J = 500 / (3,500 − 3,000) = 1.0 stb/d/psi
If the pressure is lowered to 2,500 psi, and the reservoir stays above the bubble point, the expected rate is 1.0 × (3,500 − 2,500) = 1,000 stb/d.
For single-phase oil, PI depends on permeability, pay thickness, fluid viscosity, formation volume factor, drainage radius and skin. Higher permeability and thicker pay give a higher PI. Damage (positive skin) lowers it. See also Well Performance Evaluation.
Straight-Line IPR (Undersaturated Oil)
When Pwf stays above the bubble point pressure, only liquid flows in the reservoir. PI is then constant and the IPR is a straight line from Pr on the pressure axis. This applies to undersaturated oil reservoirs. Learn more about fluid types in Classification of Reservoir Fluids.
Curved IPR: Vogel’s Equation
Below the bubble point, gas comes out of solution in the reservoir. Free gas takes up pore space and reduces the oil’s relative permeability, and oil viscosity rises as it loses gas. As a result, each extra psi of drawdown gives less extra oil, and the IPR curves.
The most widely used empirical model for this case is Vogel’s equation (1968):
q / qmax = 1 − 0.2 (Pwf / Pr) − 0.8 (Pwf / Pr)2
Worked example
A saturated oil well has Pr = 3,000 psi, which equals the bubble point. A test gives q = 400 stb/d at Pwf = 2,000 psi.
- Pwf / Pr = 2,000 / 3,000 = 0.667
- q / qmax = 1 − 0.2(0.667) − 0.8(0.667)2 = 1 − 0.133 − 0.356 = 0.511
- qmax = 400 / 0.511 ≈ 783 stb/d
Now you can predict the rate at any pressure:
| Pwf (psi) | Oil rate (stb/d) |
|---|---|
| 3,000 | 0 |
| 2,500 | 217 |
| 2,000 | 400 |
| 1,500 | 548 |
| 1,000 | 661 |
| 500 | 739 |
| 0 | 783 |
Notice that halving Pwf from 2,000 to 1,000 psi does not double the rate. It increases it by about 65%. This is the curved IPR effect.
Other IPR Models
- Composite (generalized Vogel) IPR: a straight line above the bubble point and a Vogel curve below it, for reservoirs where Pr is above Pb but Pwf drops below it.
- Fetkovich equation: q = C (Pr2 − Pwf2)n, often used for gas wells and fitted to multi-rate test data.
- Standing’s extension: adjusts Vogel for damaged or stimulated wells.
How the IPR Is Used
- Nodal analysis: the IPR (what the reservoir can deliver) is plotted against the tubing performance curve (what the tubing can lift). Where they cross is the well’s operating point.
- Artificial lift design: pumps and gas lift are sized to reach a target Pwf and rate.
- Stimulation decisions: comparing the actual PI with the expected PI shows whether the well is damaged and might benefit from fracturing or acidizing.
- Forecasting: as reservoir pressure declines, the IPR curve shifts down and left.
The data for an IPR come from flow tests and bottom hole pressure surveys.
Frequently Asked Questions
What is the difference between IPR and PI?
PI is a single number (rate per psi of drawdown). The IPR is the full curve of rate versus pressure. For a straight-line IPR, the PI is its slope.
Why does the IPR curve below the bubble point?
Free gas reduces the oil’s ability to flow through the rock, so extra drawdown produces less extra oil.
Can a well actually produce at qmax?
No. Reaching zero bottom hole pressure is impossible in practice, so AOF is a theoretical reference value.
Conclusion
The IPR links bottom hole pressure to flow rate. Above the bubble point it is a straight line defined by the productivity index. Below it, Vogel’s equation gives a curved relationship. Knowing the IPR is essential for nodal analysis, artificial lift design and spotting damaged wells.
Next in this series: Part 7, Types of Artificial Lift.
Leave a Reply